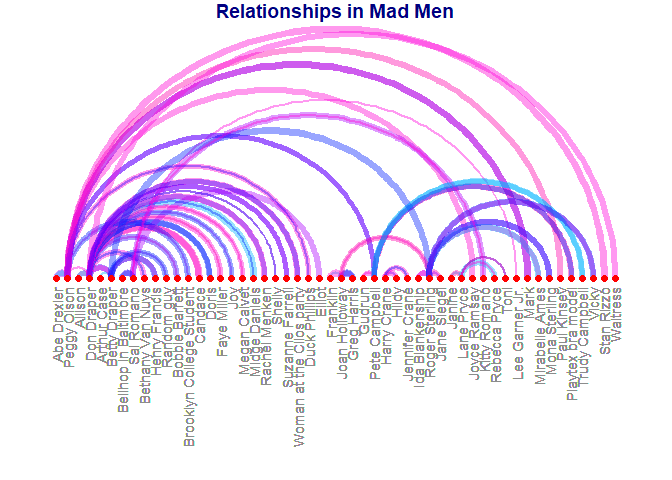
Arc Plot
NetworkPlot
Hilary February 4, 2018
library(gcookbook)
## Warning: package 'gcookbook' was built under R version 3.4.3
library(igraph)
## Warning: package 'igraph' was built under R version 3.4.3

##
## Attaching package: 'igraph'

## The following objects are masked from 'package:stats':
##
##     decompose, spectrum

## The following object is masked from 'package:base':
##
##     union
madmen
##             Name1                    Name2
## 1    Betty Draper            Henry Francis
## 2    Betty Draper               Random guy
## 3      Don Draper                  Allison
## 4      Don Draper         Bethany Van Nuys
## 5      Don Draper             Betty Draper
## 6      Don Draper           Bobbie Barrett
## 7      Don Draper                  Candace
## 8      Don Draper                    Doris
## 9      Don Draper              Faye Miller
## 10     Don Draper                      Joy
## 11     Don Draper             Megan Calvet
## 12     Don Draper            Midge Daniels
## 13     Don Draper            Rachel Menken
## 14     Don Draper                   Shelly
## 15     Don Draper          Suzanne Farrell
## 16     Don Draper Woman at the Clios party
## 17    Harry Crane                    Hildy
## 18    Harry Crane           Jennifer Crane
## 19  Joan Holloway                 Franklin
## 20  Joan Holloway              Greg Harris
## 21  Joan Holloway           Roger Sterling
## 22     Lane Pryce                   Janine
## 23     Lane Pryce            Rebecca Pryce
## 24     Lane Pryce                     Toni
## 25    Peggy Olson              Abe Drexler
## 26    Peggy Olson Brooklyn College Student
## 27    Peggy Olson            Duck Phillips
## 28    Peggy Olson                     Mark
## 29    Peggy Olson            Pete Campbell
## 30  Pete Campbell                   Gudrun
## 31  Pete Campbell        Playtex bra model
## 32  Pete Campbell           Trudy Campbell
## 33 Roger Sterling          Ida Blankenship
## 34 Roger Sterling              Jane Siegel
## 35 Roger Sterling           Mirabelle Ames
## 36 Roger Sterling            Mona Sterling
## 37 Roger Sterling                    Vicky
## 38     Sal Romano     Bellhop in Baltimore
## 39     Sal Romano             Kitty Romano
m <- madmen[1:nrow(madmen) %% 2 == 1, ]
g <- graph.data.frame(m, directed=FALSE)

plot(g)
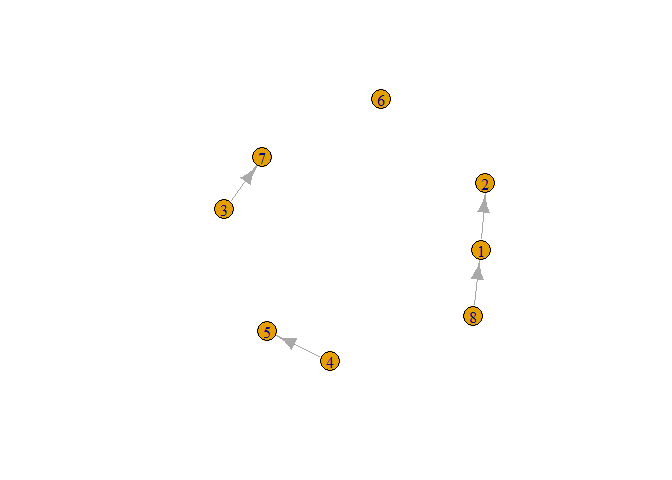
points <- graph(c(1,2, 4,5, 3,7, 8,1))
plot(points)
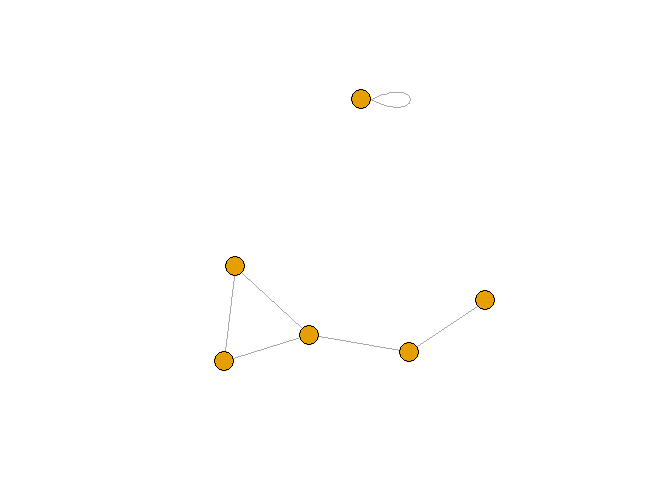
set.seed(6)
gu <- graph(c(1,2, 2,3, 2,4, 1,4, 5,5, 3,6), directed=FALSE)
# No labels
plot(gu, vertex.label=NA)
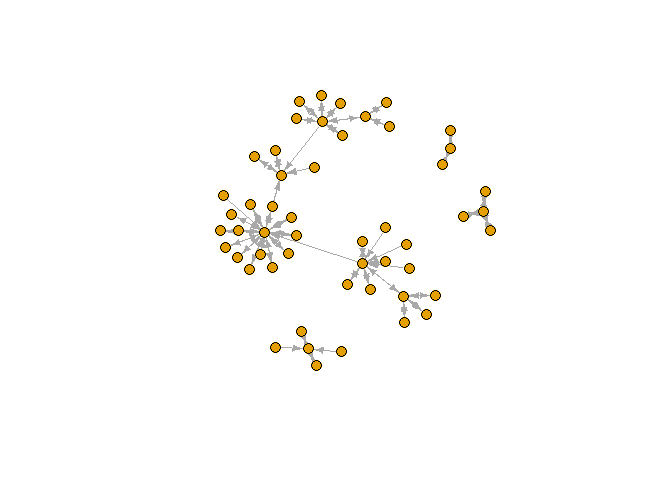
g <- graph.data.frame(madmen2, directed=TRUE)

plot(g, layout=layout.fruchterman.reingold, vertex.size=8, edge.arrow.size=0.5,
     vertex.label=NA)
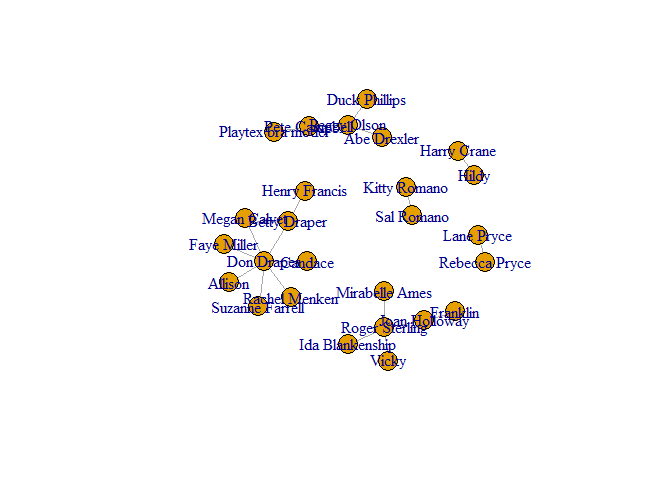
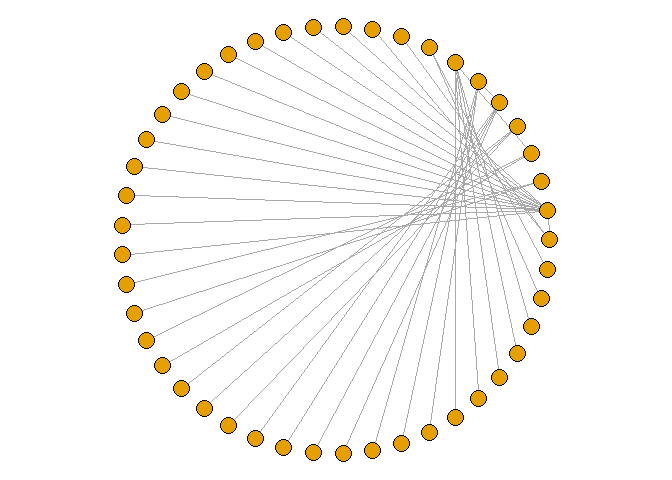
gg <- graph.data.frame(madmen, directed=FALSE)
par(mar=c(0,0,0,0)) # Remove unnecessary margins
plot(gg, layout=layout.circle, vertex.size=8, vertex.label=NA)
#library(devtools)
#install_github('arcdiagram', username='gastonstat')
library(arcdiagram)
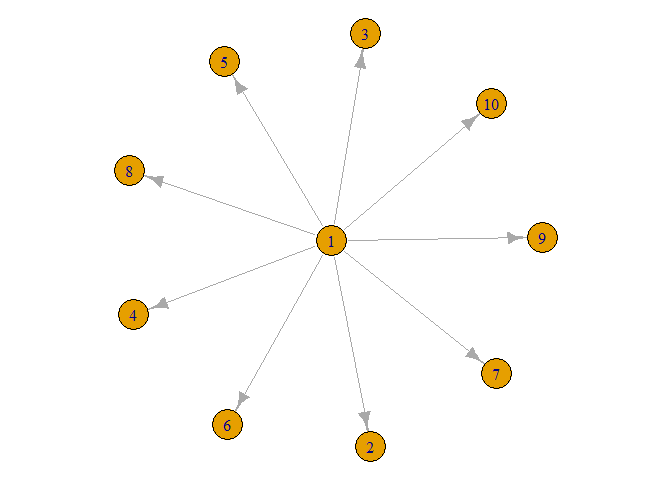
star_graph = graph.star(10, mode="out")
star_graph
## IGRAPH a9d9727 D--- 10 9 -- Out-star
## + attr: name (g/c), mode (g/c), center (g/n)
## + edges from a9d9727:
## [1] 1-> 2 1-> 3 1-> 4 1-> 5 1-> 6 1-> 7 1-> 8 1-> 9 1->10
plot(star_graph)
star_edges = get.edgelist(star_graph)
star_edges
##       [,1] [,2]
##  [1,]    1    2
##  [2,]    1    3
##  [3,]    1    4
##  [4,]    1    5
##  [5,]    1    6
##  [6,]    1    7
##  [7,]    1    8
##  [8,]    1    9
##  [9,]    1   10
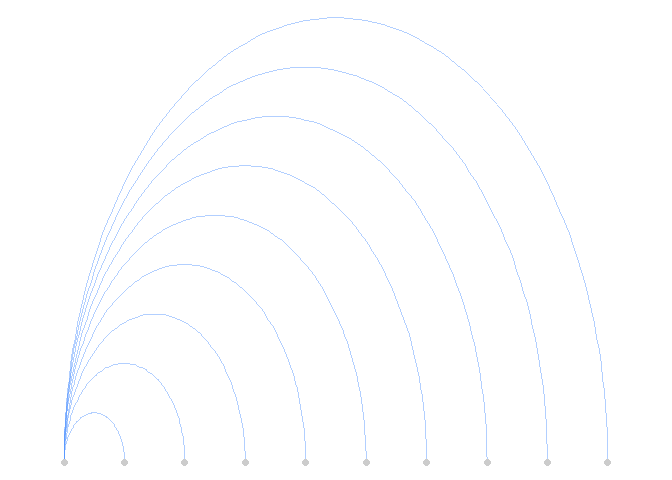
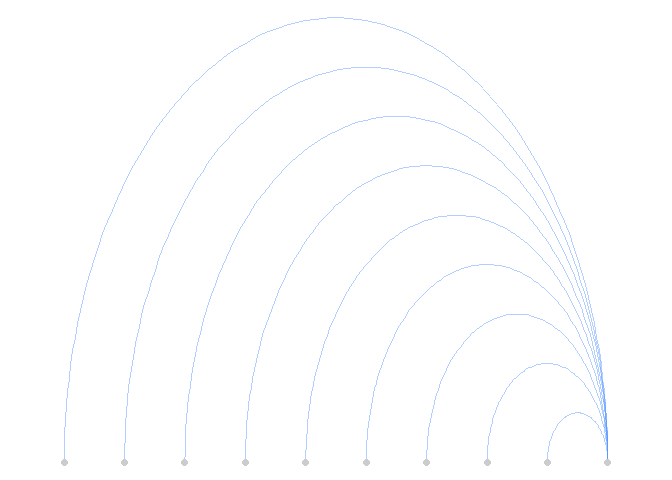
arcplot(star_edges)
arcplot(star_edges, show.nodes=TRUE, sorted=TRUE, decreasing=TRUE, las=1)
?arcplot
## starting httpd help server ...

##  done
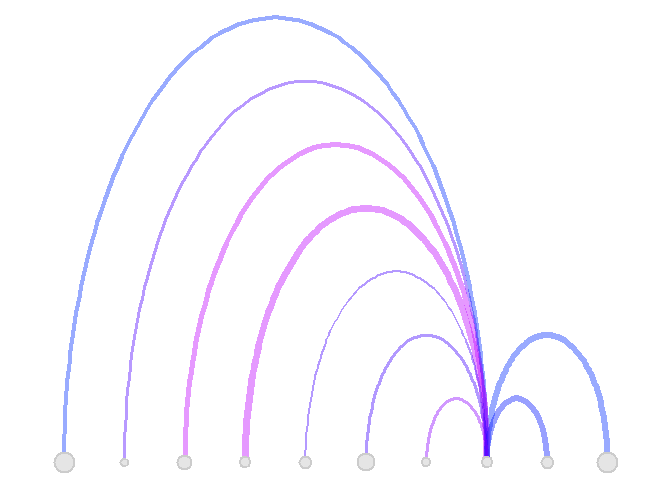
#cool arc diagram
set.seed(120)
arcplot(star_edges, ordering=sample(1:10), labels=paste("node",1:10,sep="-"),
        lwd.arcs=4*runif(10,.5,2), col.arcs=hsv(runif(9,0.6,0.8),alpha=0.4),
        show.nodes=TRUE, pch.nodes=21, cex.nodes=runif(10,1,3),
        col.nodes="gray80", bg.nodes="gray90", lwd.nodes=2)
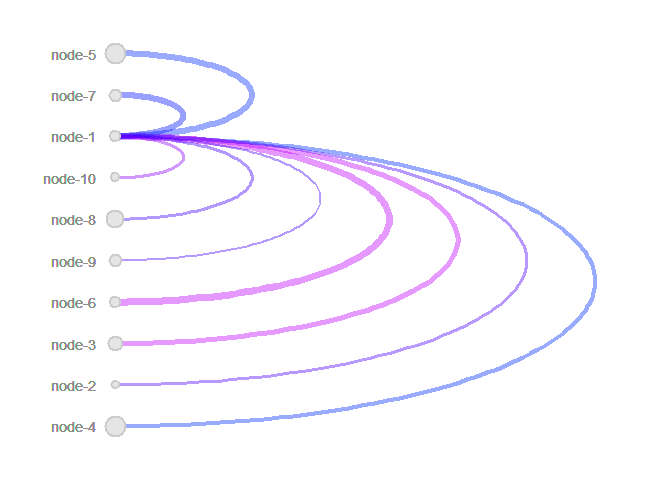
#different orientation
set.seed(120)
op = par(mar = c(0.5, 5, 0.5, 3))
arcplot(star_edges, ordering=sample(1:10), horizontal=FALSE,
        labels=paste("node",1:10,sep="-"),
        lwd.arcs=4*runif(10,.5,2), col.arcs=hsv(runif(9,0.6,0.8),alpha=0.4),
        show.nodes=TRUE, pch.nodes=21, cex.nodes=runif(10,1,3),
        col.nodes="gray80", bg.nodes="gray90", lwd.nodes=2)
par(op)

par(mar = c(10,1,1,1))
madmen.edges <- get.edgelist(g)
arcplot(madmen.edges, show.nodes = TRUE, show.labels = TRUE,
        lwd.arcs=4*runif(10,.5,2), col.arcs=hsv(runif(9,0.5,0.9),alpha=0.4),
        col.nodes = "red", main = "Relationships in Mad Men",
        col.main = "navy")