Clustered vs. Correlation Matrix
View the Data:
Data transformations:
library(corrplot) # corrplot()
landsat = read.table("Landsat.txt",header=TRUE)
classlabel = as.factor(landsat[,37])
land.data = landsat[,-37]

S = cov(land.data)
R = cov2cor(S)
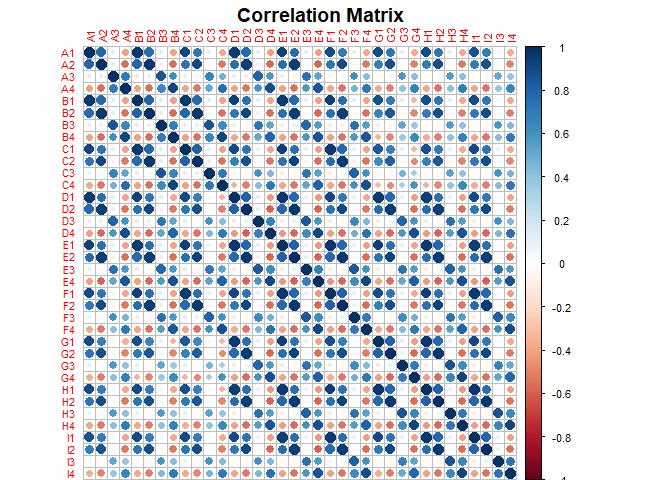
Correlation Matrix:
Plotting Using Corrplot package:
corrplot::corrplot(R,tl.cex=0.7,cl.cex=0.7,
	mar=c(0,1,1.5,2.5),title="Correlation Matrix")
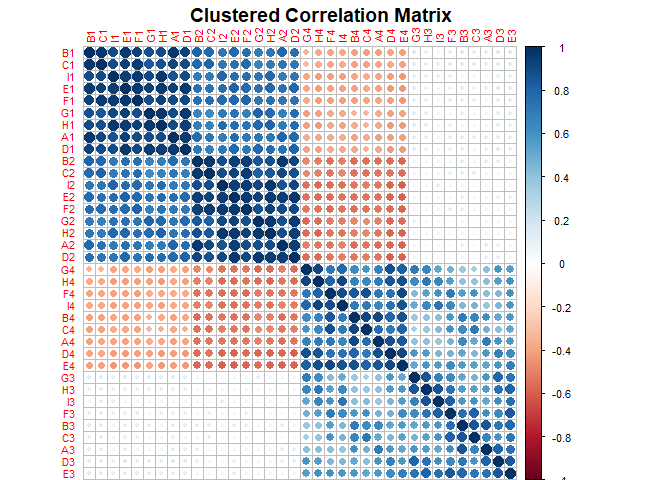
Clustered Correlation Matrix:
corrplot::corrplot(R,order="hclust",tl.cex=0.7,
				   cl.cex=0.7,mar=c(0,1,1.5,2.5),
                   title="Clustered Correlation Matrix")